

SecurityInsight documentation · Verified against SecurityInsight 3.0.79 on Nov 9, 2026
Weighted risk by CMDB service
The risk score of a finding combines its consequence (severity) with its probability (the asset’s tier) and risk factors such as internet exposure. The weighted risk score multiplies that by what the business says about the asset: the criticality and data sensitivity of its CMDB service. The same finding then ranks higher on a payroll server than on a sandbox.
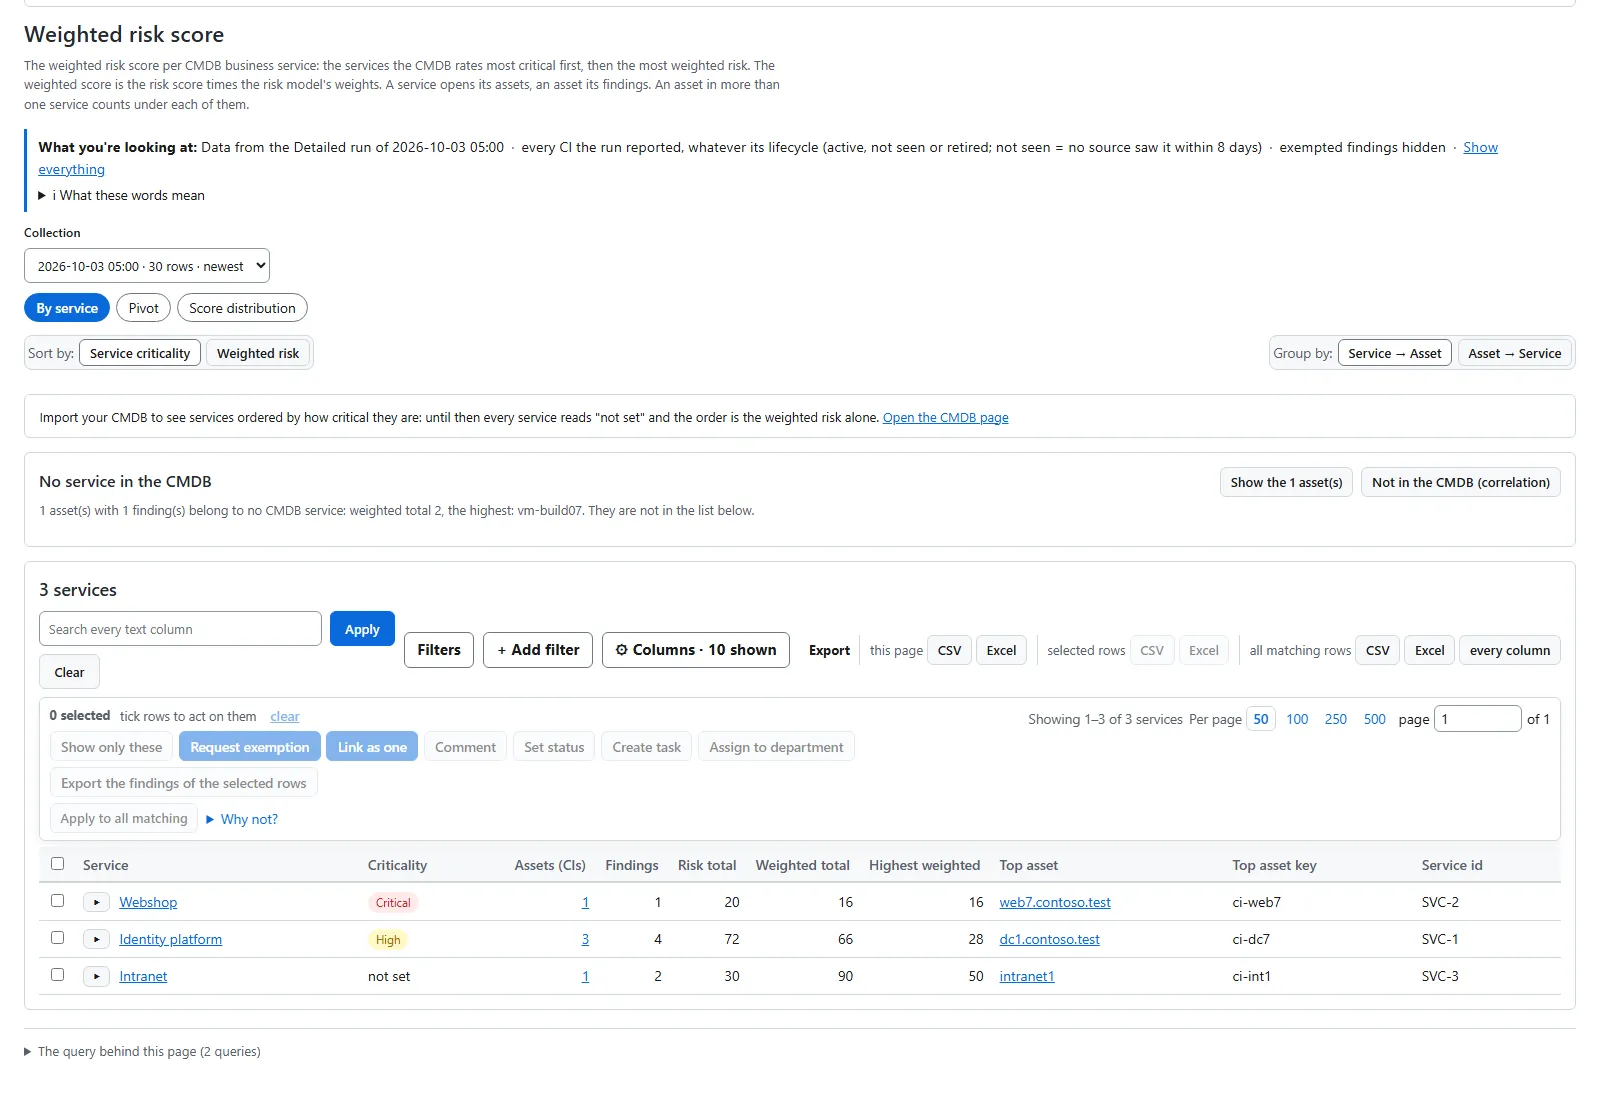
Open Assets & services > Risk scores > Weighted, per service. Pick a collection at the top; the newest is selected.
How the weight is calculated
Each criticality and each data sensitivity has a weight in your risk model: a whole number on a basis of 100 (150 = 1.5x). With the shipped sample weights, a domain controller in a Critical service (150) with Restricted data (130) gets a factor of 150 × 130 / 100 = 195 (1.95x). Admins change the weights on Configuration > Reports > Weights; a report’s own weights replace the general ones for that report.
The values come from your CMDB — or from your own profile rule where it overrides the CMDB record (see CMDB and ServiceNow).
The three tabs
By service (the default)
One row per CMDB business service in the collection:
| Column | What it shows |
|---|---|
| Service | The service. |
| Criticality | From the CMDB, as a coloured chip; not set when the CMDB has none. |
| Assets (CIs) | The service’s assets with findings. |
| Findings | The number of findings. |
| Risk total / Weighted total | The sum of the risk and weighted risk scores. |
| Highest weighted | The highest single weighted score. |
| Top asset | The asset with the highest weighted score. |
- Sort by: Service criticality (the default) puts the most critical services first, then the highest weighted risk. Weighted risk sorts by weighted risk alone.
- Group by: Service → Asset (the default) or Asset → Service turns the dimension around: one row per asset, with its most critical service and how many services it is in.
- Expand a row in place to see its assets. An asset opens its findings.
- No service in the CMDB: a band above the table counts the assets with findings that belong to no CMDB service, with links to those assets and to the correlation page’s not in the CMDB.
An asset in more than one service counts under each of them.
Pivot
Build your own view:
- Drag fields into Rows (up to 3), Columns (up to 2) or Filters (up to 6). Fields: service, service criticality, service owner, department, asset kind, asset, tier, domain, report, severity, CVE or issue.
- Drag measures into Values (up to 6): findings, assets (distinct), risk total, weighted total, highest, average.
- Click a column heading to sort. Swap rows and columns turns the table around.
Every move can also be done with the arrow buttons on each field, and with the keyboard (Tab, Enter). The table shows row totals, column totals and a grand total.
Saved views. Save this pivot as stores the view under your name. An Admin can also share a view with every reader (Share with every reader). A saved view opens from Saved views, or by its link.
Export. Export (CSV) and Export to Excel download what you see. Exports are recorded on the audit trail.
Score distribution
The spread of weighted scores, and every CI’s weighted total.
What you need for this page
- A CMDB with services and criticality. Import it or keep it on the CMDB page (Assets & services > CMDB). Until a service has a criticality, it reads not set, and the page orders by weighted risk alone, with a link to the CMDB page.
- Assets linked to services, by your CMDB, by profile rules (
cmdbId), or on the CMDB page. - A data sync after the import. The page reads the collection the data sync loaded into the SecurityInsight database.
Who sees what
A department-scoped user sees their own assets by weighted risk on By service (service totals still span every department), and only their own findings in the pivot.
Verified against SecurityInsight 3.0.79 on Nov 9, 2026Download PDF
← CMDB and ServiceNowCommunity edition: the scripts you run →