

Risk trends over time
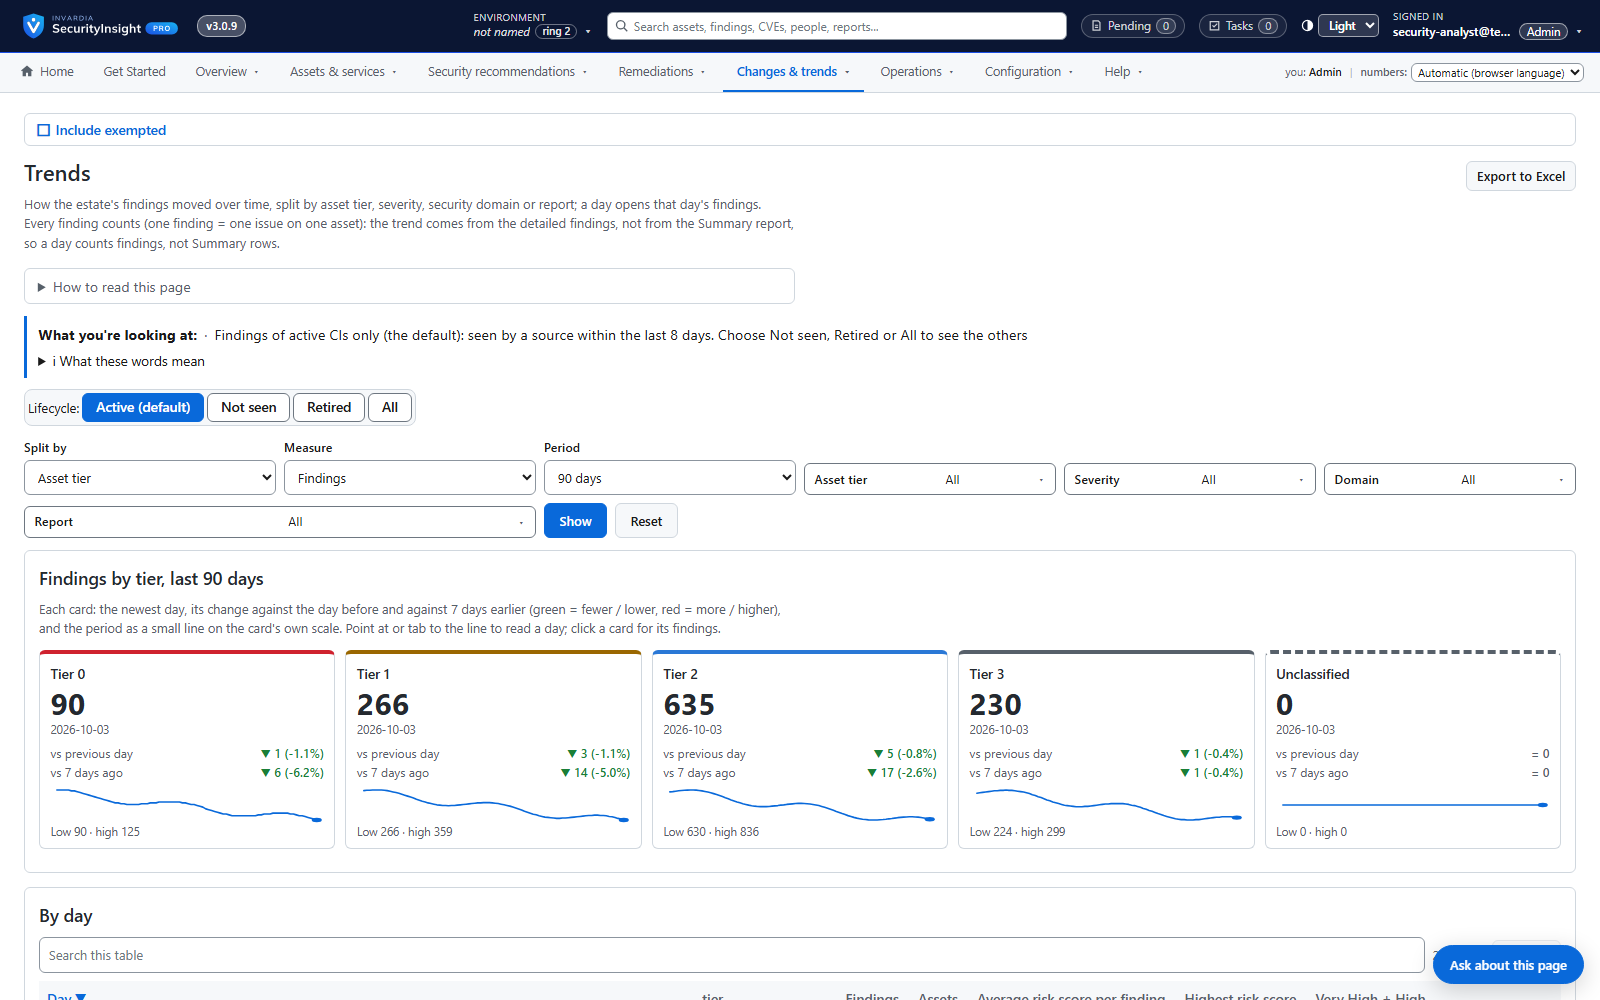
Is the estate getting safer? Daily trends by tier, severity, domain or report.
Purpose
Without a trend, every report is a snapshot and progress is impossible to show.
Design
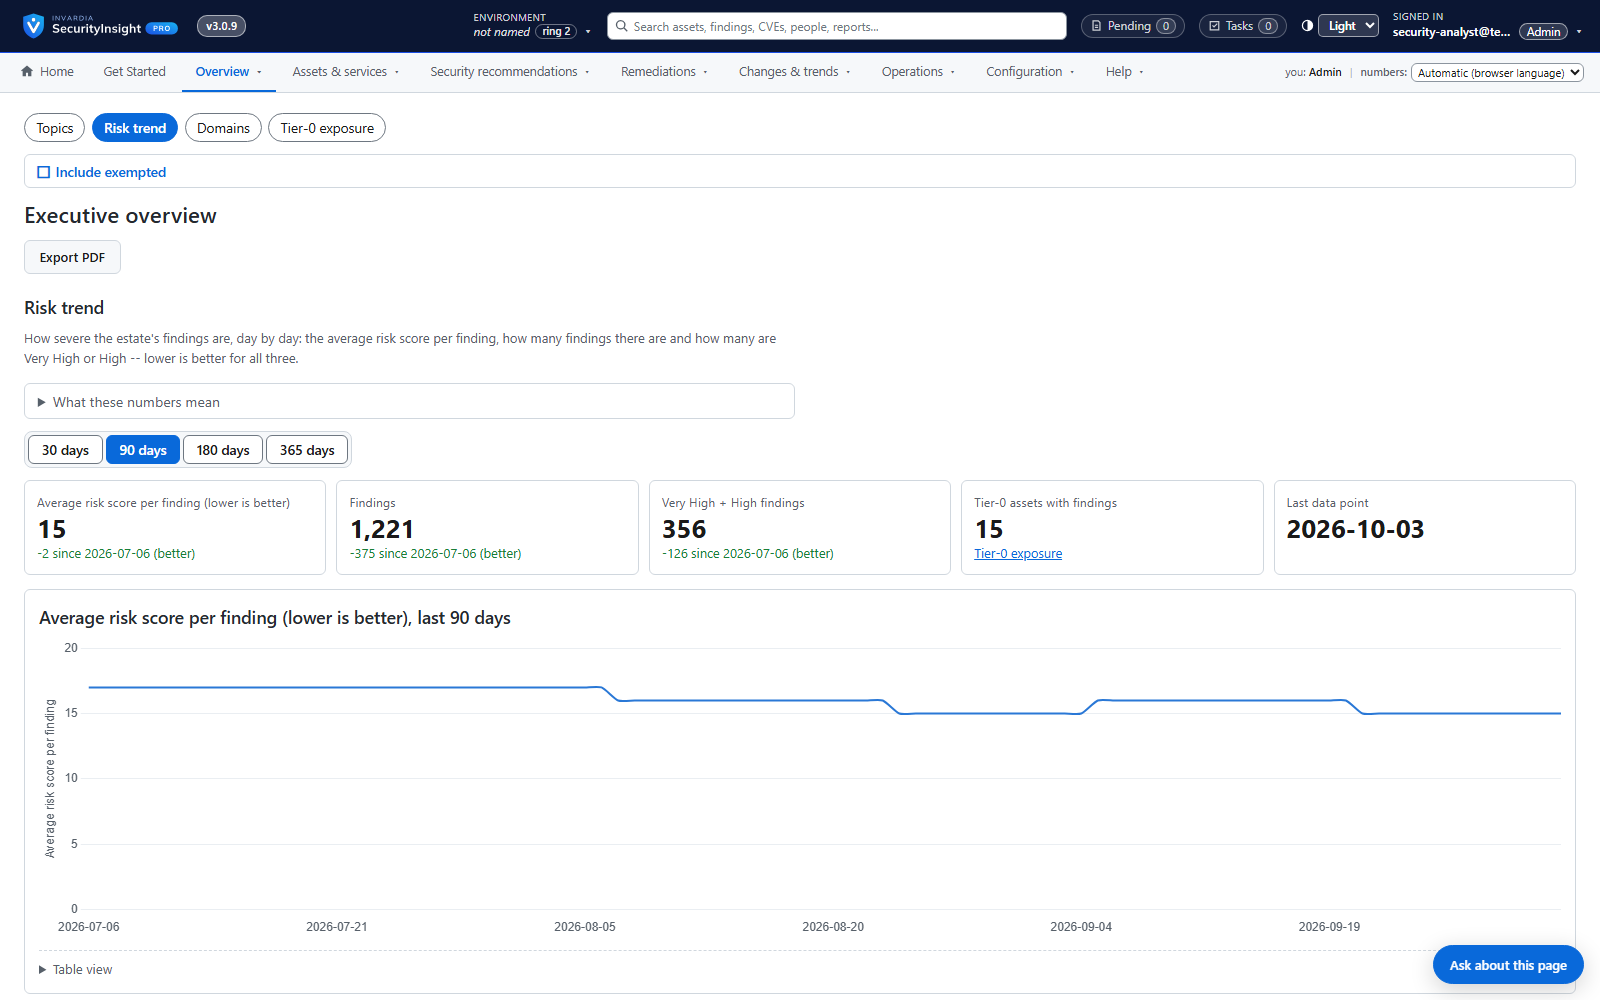
A trend engine records every day's findings in your workspace (Community: one row per day in a Log Analytics table, for the workbook or your own queries). In Pro, trend analytics splits the trend by any dimension and opens any day's collection, and the risk score page shows the average risk per finding, the number of findings and the Very High and High findings over 30 to 365 days. Sums that only grow with the number of findings are deliberately never shown.
Business opportunities
Show measurable improvement to management and auditors, and spot regressions the day they happen.
Related features
Asset profiling across endpoints, identities, Azure and public IPs
One profile per asset - device, identity, Azure resource or public IP - built automatically from the data you already have.
Privilege tier catalog
Every role and permission in your tenant ranked by what an attacker could do with it - Tier 0 to Tier 3.
Public IP exposure with Shodan
See your internet-facing addresses the way an attacker does, tied to the asset behind them.
Risk score and weighted risk score
Every finding scored for severity and likelihood, then weighted by the business criticality of its asset.